Climate shocks and output
Do climate-shock years show up in GDP and crop output?
Why I built it
Track 1 of the Environmental Economics course: take 85 years of climate records for 12 countries, measure how far the climate has moved compared with ordinary year-to-year swings, and check whether the unusual years were also unusual for GDP and harvests. Group work with Eliott Beghin, Saty Viard Laroque and Augustin Vlandas.
What it does
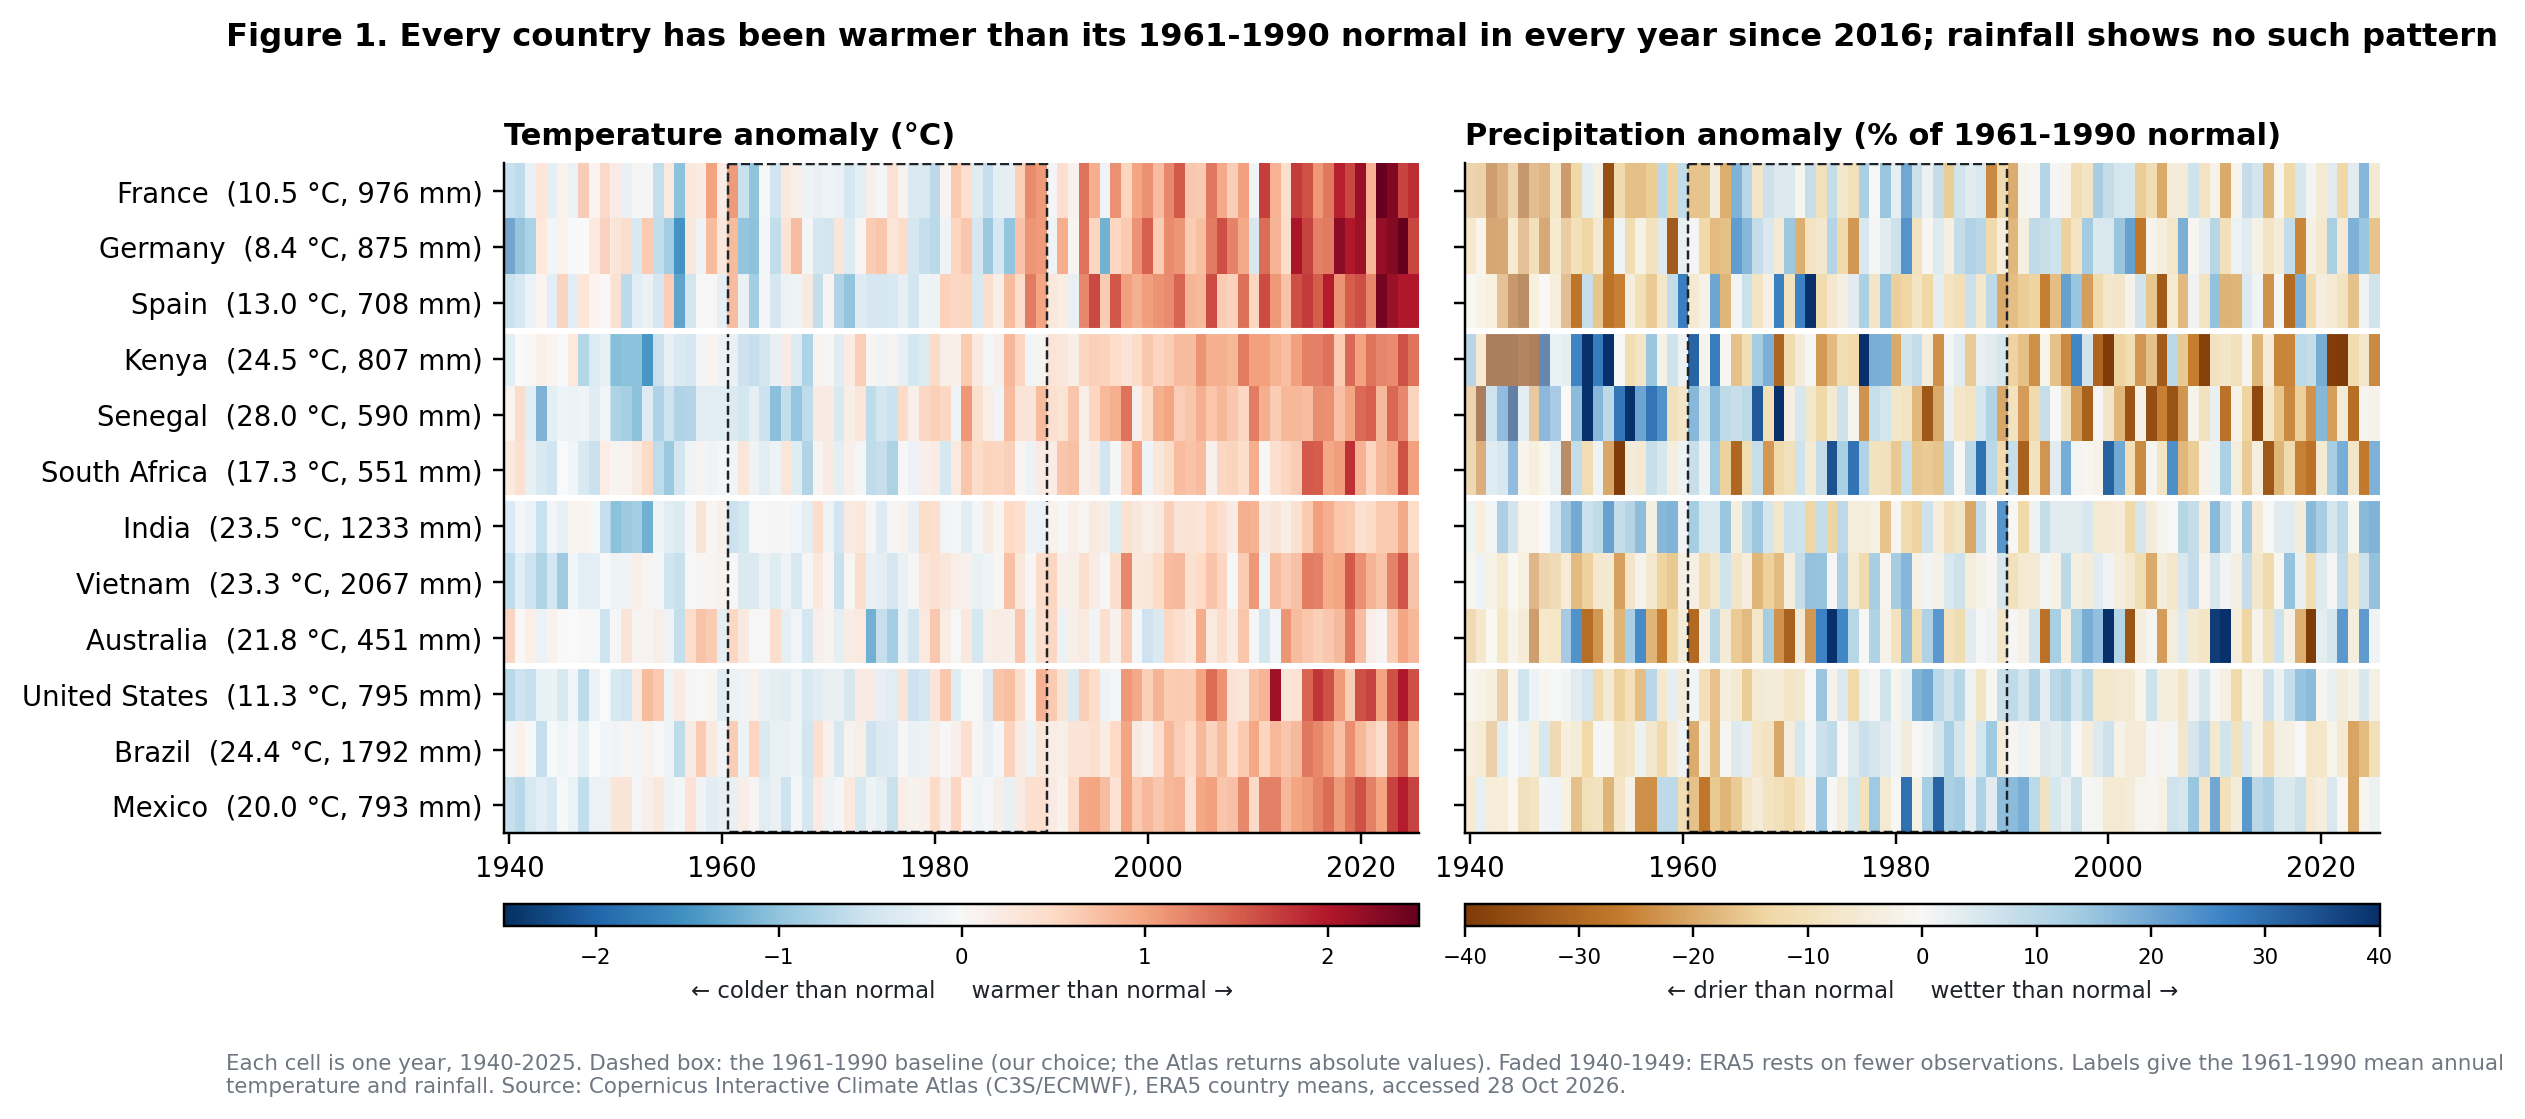
ERA5 temperature and rainfall for 12 countries from 1940 to 2025, separating warming from year-to-year noise and seasons, then testing whether shock years appear in World Bank GDP and crop data.
Worth a look
- 11 of 12 countries have warmed by more than twice the normal year-to-year swing.
- Crop output rises about 2.2% in a year with 10% more rain. GDP growth shows no detectable effect of temperature.
Under the hood
Climate data
ERA5 temperature and rainfall by country, 1940 to 2025, from the Copernicus Climate Atlas, against a 1961–1990 baseline.
Measure the shift
How far each country has moved in units of its own ordinary year-to-year swing, overall and season by season.
Join the economy
World Bank GDP growth and crop output for the same country-years.
Panel models
Country and year effects plus country trends, with every claim labelled description or correlation, never causation.
Reproducible
Scripts 00 to 08 regenerate every number in the paper, which was submitted on 2 November and presented on 9 November.