ShockGraph PEA
If oil goes up 20%, what happens to my PEA, and through which links?
Why I built it
More and more French students open a PEA and stack a World ETF, an S&P 500 ETF and a few stocks, thinking they are diversified. Two “World” ETFs can hold the same 1,500 companies. I wanted a tool that shows what a portfolio is really exposed to. Built for the GraphDB course with Eliott Beghin and Saty Viard Laroque.
What it does
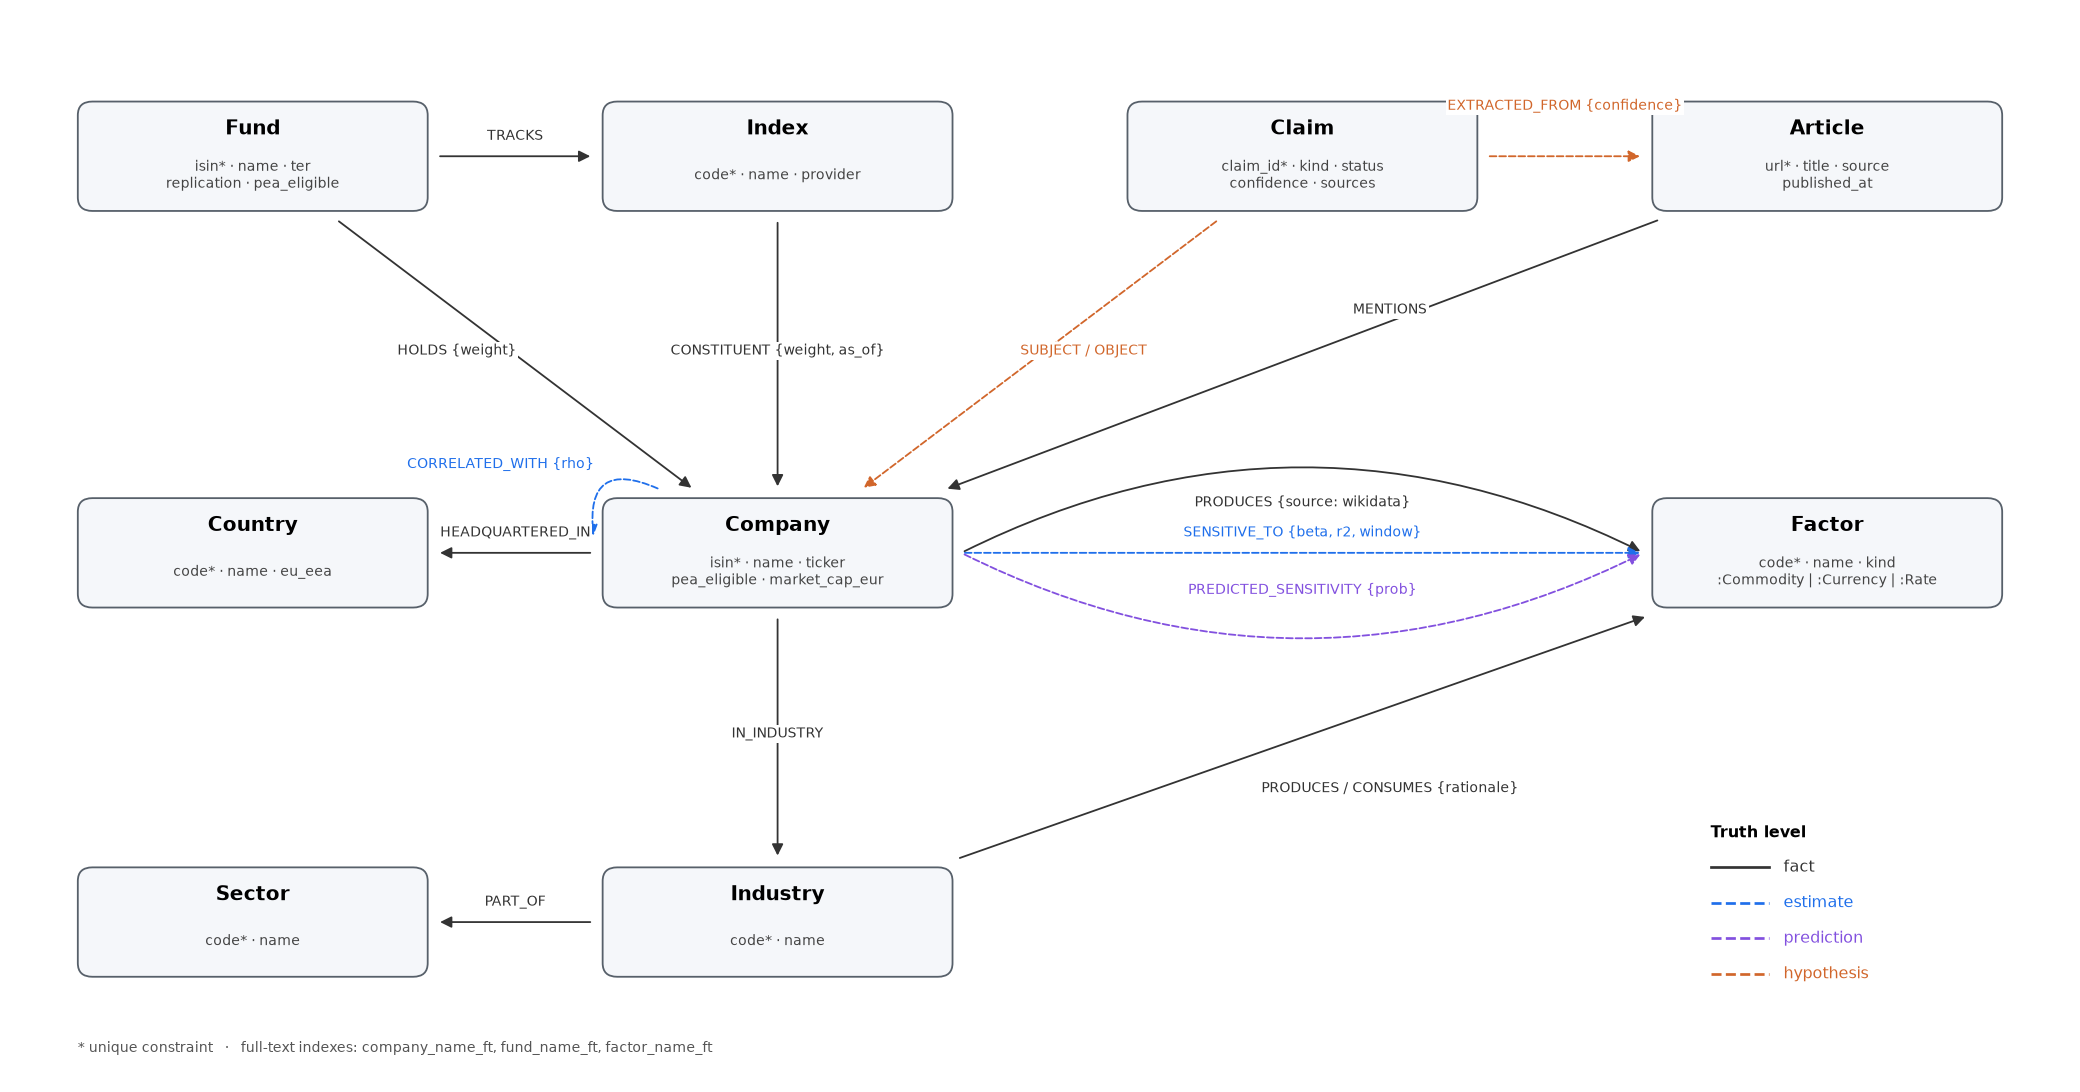
A Neo4j graph of PEA-eligible stocks, their sectors, countries, commodities, currencies and the ETFs that hold them. It shows what a portfolio is really exposed to, simulates how a shock spreads, and explains it through a local LangGraph agent that labels every number as a fact, an estimate, a prediction or a hypothesis.
Worth a look
- Look-through of ETFs down to companies, aggregated by sector, country and factor.
- Graph Data Science on the residual correlation network: Louvain communities, PageRank, FastRP embeddings.
- The agent refuses investment advice by rule and a verifier strips unsupported claims.
Under the hood
A graph of the market
PEA-eligible stocks, sectors, countries, commodities, currencies and the ETFs that hold them, stored as nodes and links in Neo4j.
Look-through
Fund → index → company, then aggregated by company, sector, country and factor, so overlapping ETFs show up.
Shock simulation
Direct impact is beta × shock (an estimate); declared producers and consumers are facts; one more hop through news-based links is only a hypothesis, with no number.
Graph Data Science
Louvain communities, PageRank and FastRP embeddings on the residual correlation network answer “which stocks move together?”.
A careful agent
A local LangGraph agent with typed tools and a guarded Cypher fallback. It refuses investment advice by rule, and a verifier strips every claim the evidence does not support.
FastAPI on top
X-ray, shock, path and cluster endpoints; every number comes with its truth level (fact, estimate, prediction, hypothesis).